daylite
Active Member
-The Fisher 500C loudness contour circuit was modeled in SPICE.
-Choices for loudness circuit components are discussed.
For my 500C project I am considering modifying the Fisher 500C loudness switch circuit. It is a passive filter with three* components: C63, C64, and R91. To get a better idea of what the filter might be capable of, I modeled the circuit with SPICE. *(The volume pot with tap is a fourth component not modeled here other than to employ resistors representing a single volume setting.)
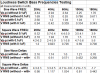
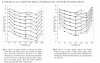
The three figures below show the effects of about 24 combinations of component values. For each figure one of the components is held constant, while four values of a second component are tried with each of two choices of the third component. This gives eight component combinations in each figure.
I.

II.

III.

The observed effects are in line with what Dave described in this 2016 post. A calculated curve for a set of components may have systematic inaccuracies - there has been no instrument-based testing of the model.
I'm posting these results in case other readers may find them useful. They'll be useful if the observable trends help us predict the effect of a component substitution and estimate a magnitude for that effect. With these results as a guide I’m experimenting with loudness contour component changes. -d (Saturday tomorrow...back to the bench! )
)
-Choices for loudness circuit components are discussed.
For my 500C project I am considering modifying the Fisher 500C loudness switch circuit. It is a passive filter with three* components: C63, C64, and R91. To get a better idea of what the filter might be capable of, I modeled the circuit with SPICE. *(The volume pot with tap is a fourth component not modeled here other than to employ resistors representing a single volume setting.)
The three figures below show the effects of about 24 combinations of component values. For each figure one of the components is held constant, while four values of a second component are tried with each of two choices of the third component. This gives eight component combinations in each figure.
I. Effects of C63 (C64=0.02uF, R91=22K and 68K)
II. Effects of R91 (C63=120p, C64=0.02uF and 0.082uF)
III. Effects of C64 (C63=180p, R91=22K and 68K)
II. Effects of R91 (C63=120p, C64=0.02uF and 0.082uF)
III. Effects of C64 (C63=180p, R91=22K and 68K)
I.
II.
III.
The observed effects are in line with what Dave described in this 2016 post. A calculated curve for a set of components may have systematic inaccuracies - there has been no instrument-based testing of the model.
I'm posting these results in case other readers may find them useful. They'll be useful if the observable trends help us predict the effect of a component substitution and estimate a magnitude for that effect. With these results as a guide I’m experimenting with loudness contour component changes. -d (Saturday tomorrow...back to the bench!
)
Last edited:


 ] -d
] -d

 [P.S. Your post appeared Jan 10, 2020. Little did we know how the world was about to change...]