


k6sti
Active Member

This demonstrates how to optimize load resistance for a ceramic filter. The plots are for a Murata SFE10.7MA5-A. It was measured using a 50 ohm VNA. I renormalized the response to 330 ohms with the plotting program. The white curve is the group delay response had the filter been loaded with 330 ohms. I made a copy of the file and varied the load resistance. 220 ohms yielded lowest group delay variation. At 330 ohms, it is just over a microsecond in the 10.6-10.8 MHz passband. It's about 75% as much at 220 ohms.
This neglects the effect of other filters and other circuitry. Still, it's quite easy to optimize the load resistance for an isolated filter for lowest group delay variation. This will reduce audio distortion.
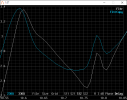
This is the reverse direction. 230 ohms was slightly better than 220 ohms. The filter was measured in both directions with a VNA that measures S11 and S21. A program included with the plotter merged the two files into one that contained S11, S21, S12, and S22. All four S-parameters are needed for the most accurate reference impedance renormalization.
The plotting program is at the top of this page:
Measurement Utilities
Downloading instructions are at the bottom of the page.
Brian
Last edited:


