• The move to the new server is done. There are some software and database maintenance updates in process. This has us passing the hat around to help out. We appreciate any donations. Seriously, even a dollar helps. The payment page may be found here - https://www.audiokarma.org/support.html

Heyboer Williamson Bode Plots

zackthedog

AK Subscriber
Subscriber
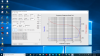
CE261127-01D7-4683-9107-645E2E65761A.png 390F71E8-B507-42E6-9FCE-7215C32836D0.png So I ran two Bode plots on the Heyboer Williamson using an FRA analyzer with Picoscope, helpfully suggested in a previous thread. The first shot is *without* the step network and phase lead cap, the second shot is *with* the step network and phase lead cap in place. The built-in function generator only goes up to 100kHz so I'm limited to that at the moment. Can someone give me a rough idea of what I'm looking at? I *am* reading as much as I can to understand this, but some pointers in the right direction would be greatly appreciated!
 
Register to hide this ad
Were you able to run a loopback plot? Given the interest is higher frequency, then need to confirm your test setup has no quirky response as you approach a limit (100kHz), or if your probes are appropriately compensated or calibrated. Do you have a link to the FRA analyser and how the test is done?

I'd aim to do many more than 10 steps per decade, as phase/magnitude changes near a resonance can be quite abrupt, and you may miss seeing wiggles.

I'd recommend doing a plot with feedback disconnected - with and without step network.

If you were looking at low frequency (<10Hz), you would aim to make measurements with the same output voltage so as to apply the same OPT excitation level, and to also not have too high an excitation level as distortion may be substantial. But for just HF response, it is mainly about keeping the output level sufficiently under any clipping level.

 
Were you able to run a loopback plot? Given the interest is higher frequency, then need to confirm your test setup has no quirky response as you approach a limit (100kHz), or if your probes are appropriately compensated or calibrated. Do you have a link to the FRA analyser and how the test is done?

I'd aim to do many more than 10 steps per decade, as phase/magnitude changes near a resonance can be quite abrupt, and you may miss seeing wiggles.

I'd recommend doing a plot with feedback disconnected - with and without step network.

If you were looking at low frequency (<10Hz), you would aim to make measurements with the same output voltage so as to apply the same OPT excitation level, and to also not have too high an excitation level as distortion may be substantial. But for just HF response, it is mainly about keeping the output level sufficiently under any clipping level.

Thanks, Tim, let me work on that. Here's a link to the software. There's not much information:

https://bitbucket.org/hexamer/fra4picoscope/wiki/Home

Can you explain how I would run a loopback test?
 
Ok, a few queries for starters :)

Where does the source signal come from and how does it get to the input terminals of your amp?

How do you get the amp output signal in to your scope?

Are you using a resistor load, and is it the same level as the OT impedance setting?

A loopback test would connect the source signal to the scope input (coming from your amp's output) using the same test leads and probe, but not connecting to the output load resistor. That test should have 0dB gain (if using a 1:1 probe for scope input) and be flat for amplitude and gain across the frequency spectrum of interest. Best to do that test with the leads/probe on your bench and close to the amp, and repeat that test with the ground lead connected to the amp output 0V terminal with the amp powered (to check for quirky ground loops).

This type of test typically requires that the amp have its input terminal ground connected through to the speaker output 0V terminal - some measurement equipment like soundcards have a common ground for line out and line in.
 
Okay, here's how I have it set up. The Picoscope has a built-in signal generator. That is connected to the amp input via a BNC adapter and shielded RCA cable. I have a 1X probe going from the grid of the input tube to Channel A, and a 1X probe connected across an 8 ohm load resistor at the output going to Channel B.

All grounds in the amp go to a single ground buss. The amp ground is floating. I'm trying to visualize the loopback test.
 
Generally a loop back test connects the signal out directly to an input channel. This lets you check for inaccuracies in the measuring system and account them in your measurements of the DUT (device under test).
 
Generally a loop back test connects the signal out directly to an input channel. This lets you check for inaccuracies in the measuring system and account them in your measurements of the DUT (device under test).

Ah, got it, thanks!
 
From this and your other posts about the Heyboer amp, I am seriously thinking I should get one of these picotech USB scopes. I have zeroed in on the 2206B model at this point. Next Monday is payday. Maybe???

Your project and process have been fun to watch.
Thanks,
John
 
From this and your other posts about the Heyboer amp, I am seriously thinking I should get one of these picotech USB scopes. I have zeroed in on the 2206B model at this point. Next Monday is payday. Maybe???

Your project and process have been fun to watch.
Thanks,
John

Well, it's a lot of fun. ;-). Wish I knew what I was doing, but there's only one way to learn. I will give you a heads up that I seem to get better results on my W10 laptop than my Mac Mini, and the software has more features.
 
Just dug my way through the picoscope website to find a datasheet, and then the datasheet to find the specs - yes you should be able to just connect function generator output to a channel input and using the 3rd party software, do a sweep and effectively see 0dB gain and o deg phase shift from 1Hz to 100kHz. That loopback test would be a good place to try out all the possible control variations with the scope and the software, such as voltage level, extra resolution, steps per decade, ... to get some confidence in knowing how to set up the jig and what to expect.
 
Last edited:
Just dug my way through the picoscope website to find a datasheet, and then the datasheet to find the specs - yes you should be able to just connect function generator output to a channel input and using the 3rd party software, do a sweep and effectively see 0dB gain and o deg phase shift from 1Hz to 100Hz. That loopback test would be a good place to try out all the possible control variations with the scope and the software, such as voltage level, extra resolution, steps per decade, ... to get some confidence in knowing how to set up the jig and what to expect.

You are tireless! Many thanks, I will investigate.
 
Just wondering if you were able to push the Picoscope in to service for doing gain-phase measurements, and what low and high frequency limits you could get to - as I recall seeing a Picoscope plot out to 1Mhz a little while ago but can't locate that reference now.
 
Just wondering if you were able to push the Picoscope in to service for doing gain-phase measurements, and what low and high frequency limits you could get to - as I recall seeing a Picoscope plot out to 1Mhz a little while ago but can't locate that reference now.

That was the 2204. I bought a 2206B, which has a 1MHz function generator.
 
Honestly, I didn't test for that. I'm not sure how I'd do it--connect both input and output to the AWG? I also don't know what the lower frequency limit is.
 
It looks like the 2206B has a 2Vpk max output level in to 600ohm that would be the input to the amp. The specs indicate the generated signal magnitude is within 0.5dB from dc to 1MHz. Normally the picoscope AWG generator output would be taken via a BNC splitter to the amp input and to the picoscope channel A input. The output of the amp would be taken to the picoscope channel B input, but likely through a resistor divider (or 10:1 scope probe etc) as it looks like the max input level is 20Vpk. A loopback test would now connect the AWG cable over to the input of the scope probe or resistor divider (that was connecting to the amp output) - the AWG signal then passes through all the same cabling and interface parts that are being used in the amp test - the only difference may be in the channel B attenuation setting used.

If using a scope probe then it may need its compensation setting adjusted for flat line magnitude to 1MHz. If using a fixed resistor divider then care in choosing resistor type may be needed as some values and makes start to show impedance change affects below 1MHz. Cheaper shielded audio cable may be a concern, compared to using quality coax. Even if there is some change in gain or phase towards 1MHz then at least knowing the baseline performance allows any test result to be better interpreted.

Low frequency testing may take a bit of cross-checking. The app notes talk about issues when using AC coupling and making measurement steps. Resonances at low frequency can also take time to develop, as the output signal can vary the OPT inductance that then changes the output signal level, so some settling time may be needed between test samples when near a resonance frequency.

A new release of the process app came out in Feb this year, with a few bug fixes that appear relevant. The App only appears to support Win32 versions. There are quite a few process options/settings that may need to be tested to see how influential they are - including ac/dc input and noise related settings.

It certainly seems to be a neat tool for assessing and tweaking stability related circuit changes, and confirming the origin of damped resonant high frequencies that can show up in waveforms from squarewave testing of an amp.
 
Back
Top Bottom