AEA --I thoroughly applaud your efforts to provide measured performance results for the units you have restored, as that is the only scientific way to represent that a given unit has in fact been restored to factory performance specifications. It is something largely missing from this industry, but something I've done for decades, so I applaud when others have the same standards as well!
If I may however, may I suggest that a tweaking of your graphs may provide more useful information? In particular:
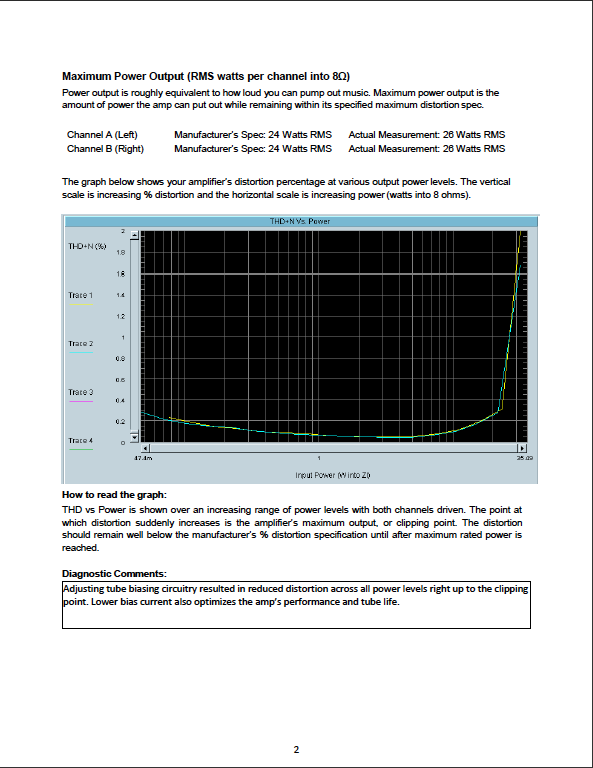
1. The graph on page 2 is for THD versus power, but yet no indication of what frequency that graph is run at is given. This is almost surely results performed at 1 kHz -- which is entirely in keeping with the rather loose way Fisher typically specified this performance criteria in their specifications offered. I would suggest that the test frequency should be identified, as distortion varies greatly with frequency as no doubt you know.
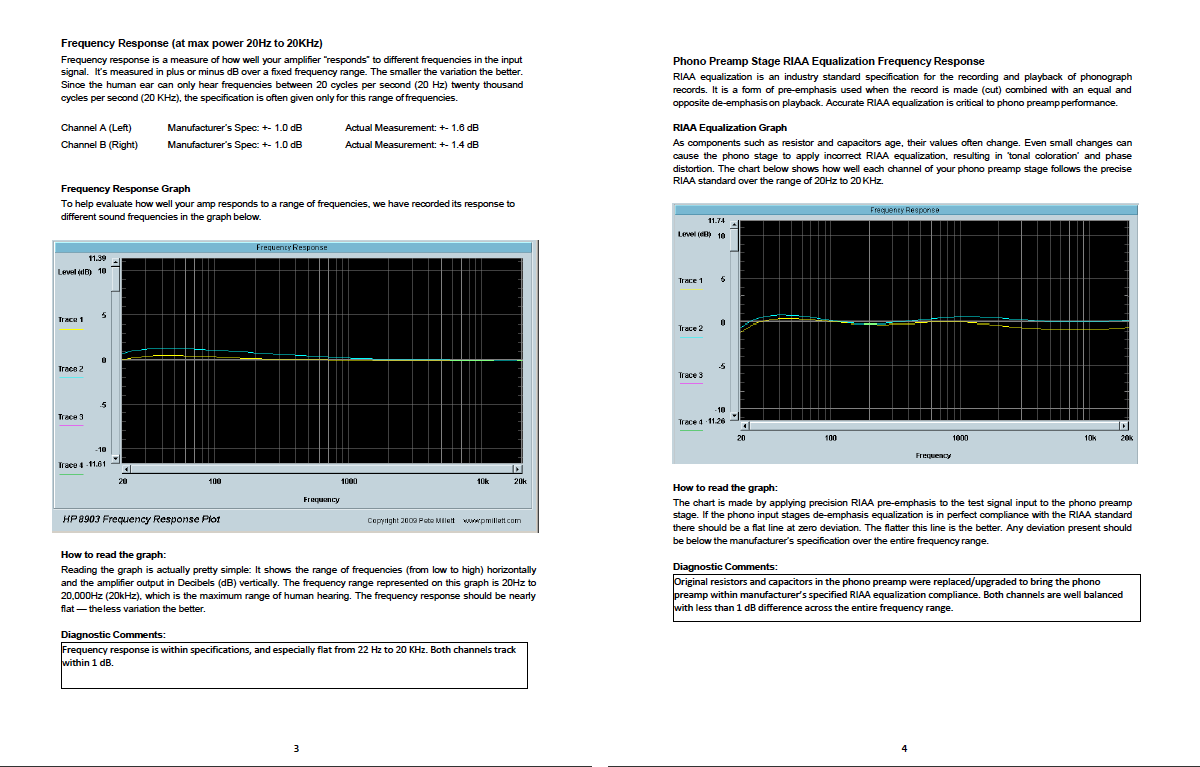
2. The graph on page 3 is of frequency response at max power. Frequency response tests are historically performed at a 1 watt power level (certainly by Fisher back in the day), so as to remove the power bandwidth element from the equation. Running the test at maximum power then brings this element into play. While the Fisher model that is the subject of the graph most likely has a flat response down to 20 Hz at a 1 watt level, any response at that frequency at an implied maximum power output of 26 watts RMS would be completely unusable due to the gross distortion levels produced -- and of course, it could never produce anywhere close to this power level at 20 Hz anyway. I would suggest then that this test would provide a more accurate representation by running and specifying the power level of the test at 1 watt, or specifying specifically what "max power" represents in this graph.
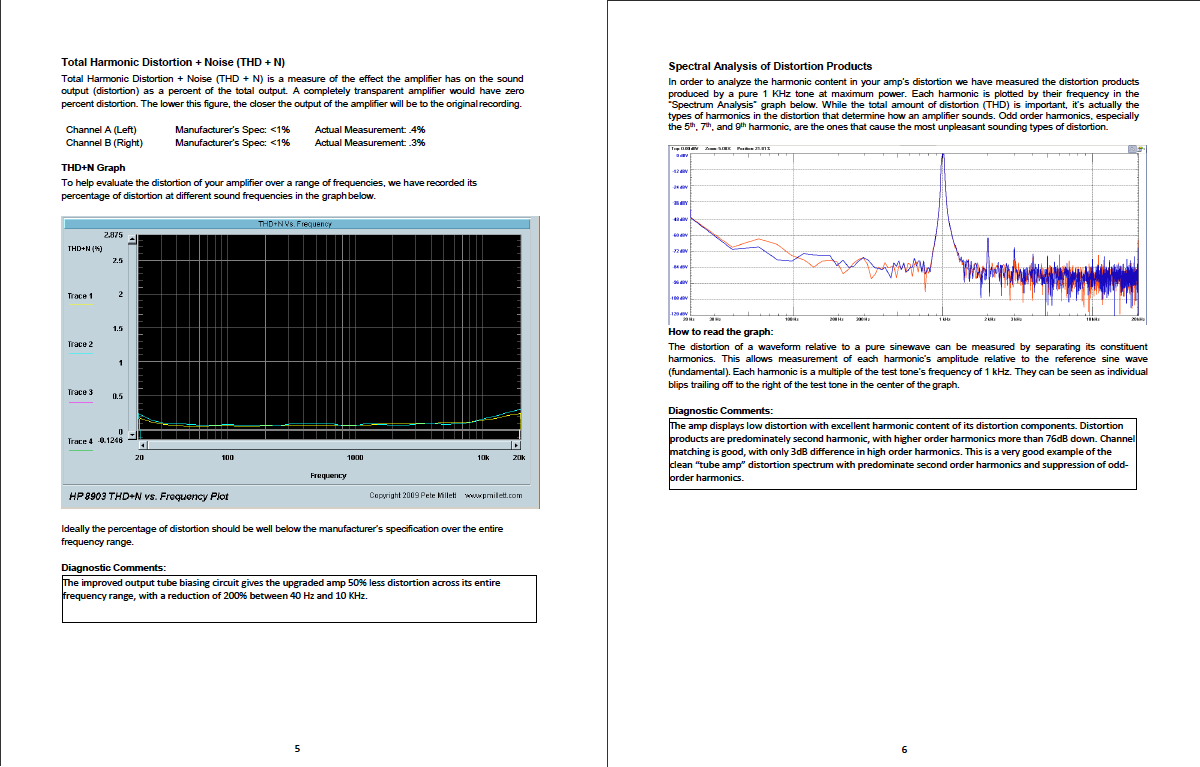
3. Finally, on page 5, the graph has THD measured against frequency, but now, power level is missing. Now granted, Fisher did not provide this information for the X-100B, but again, the graph would carry more weight if the power level was known, as it would look quite different at a power level of say within 1 db of rated power output -- which is how such curves were traditionally published. I would suggest then that the power level also be included that the graph was run at.
Again, I offer all of this only as thoughts to improve an already excellent service you perform. It may be that newer performance renderings conform to the way you have presented them. But conducting your tests in a manner that is consistent with the way they were performed back in the day would provide the clearest picture of the results from your restoration services, versus the specification provided by the manufacturer.
Thanks for entertaining these thoughts, best wishes for your company, and welcome to AK!
Dave