• The move to the new server is done. There are some software and database maintenance updates in process. This has us passing the hat around to help out. We appreciate any donations. Seriously, even a dollar helps. The payment page may be found here - https://www.audiokarma.org/support.html

How much wattage do you use, on average?

Status
Not open for further replies.
Really, that's the article this graph comes from, seems to dispute your statement lol..
Perhaps it's time for to to replace your glasses - or get some!

The rated output of the former is 450 watts where the minimum distortion value is at about the 18 watt level (4 ohms) and the latter is rated at 500 watts where the minimum value appears at about the 52 watt level (4 ohm tap).

The only point I've proved is you continue to be mistaken unless you define *full output* as being somewhere between -10 to -20 db down.
 
Last edited:
Actually, the curves are easy to understand.

The first thing to recognize is that the distortion rating is a function of the power level measured as a ratio (%) to that power level.

Assume that the components of the system create a certain level of distortion even at an infinitely low volume setting. Call this the "base" level.

As we ramp up the volume and increase the output power, this base level remains constant. So as the power increases, the ratio of distortion to power decreases for this base level distortion and you see the plot going in a downward curve so long as the power level increases faster than any distortion artifacts that are acquired beyond the base level.

But eventually (and inevitably) as the power keeps increasing the components start to exhibit their own distortions faster than the power level is increasing and the curve flattens out. The "distortion" at the "bottom" of the curve is really no lower, and may in fact be higher, than at the left side of the curve, but it is when considered relative to the power output (%).

In fact, I would think the "distortion" should be the lowest before the curve begins to flatten out, because the flattening is due to components exhibing more "distortions" that exceed the rising power level. Eventually, things really go south and the curve take a dramatic rise.

So, the amp I want is the one that begins with the lowest distortion ratio at the lowest power level recognizing that it has the lowest "inherent distortion," and most listening is done well under 1 watt.
 
Another somewhat useless way to present distortion for SS amplifiers, is to show it only at 1kHz, when a good high frequency distortion spec is much harder to achieve.

Agreed, and it's funny when even with that limitation some really cheap SS amps still have over 10% distortion. Typical.of most offerings for motorcycle stereo equipment from like Shark.
 
Perhaps it's time for to to replace your glasses - or get some!

The rated output of the former is 450 watts where the minimum distortion value is at about the 18 watt level (4 ohms) and the latter is rated at 500 watts where the minimum value appears at about the 52 watt level (4 ohm tap).

The only point I've proved is you continue to be mistaken unless you define *full output* as being somewhere between -10 to -20 db down.

Hmm, seems to me I stated as they "approach" "rated" output, not at rated output, and definitely not "full" output as you're implying.

And maybe you need glasses as I'm seeing their minimum distortion points depending on load 50watts to well over 100 watts, and still less distortion higher when compared to the extreme left of the graph. So again, thank you for providing support for my assertion.
 
Last edited:
It is the electrical formula for storage in a capacitor in joules, not mine. This time, follow the link I provided in post 155. One need only supply C and V.

Here is is again. There is a link within that link that shows the formulae used.

https://www.electronics2000.co.uk/calc/capacitor-charge-calculator.php


No debate there. Return again to your claim in post #154 where you opined:

"it's obviously dissipating way more than 35 joules."

Output stages don't dissipate joules.

I give up. I googled your formula and got nothing. It's not a formula for figuring the storage of a capacitor. That's called farad. Why you keep insisting a bank of caps is a power supply is beyond me and you don't listen.
 
Hmm, seems to me I stated as they "approach" "rated" output, not at rated output, and definitely not "full" output as you're implying.

And maybe you need glasses as I'm seeing their minimum distortion points depending on load 50watts to well over 100 watts, and still less distortion higher when compared to the extreme left of the graph. So again, thank you for providing support for my assertion.

""LOL""LOL""
 
I give up. I googled your formula and got nothing. It's not a formula for figuring the storage of a capacitor. That's called farad. Why you keep insisting a bank of caps is a power supply is beyond me and you don't listen.

Is your Pass amp an AB design, or fully Class A?
 
I give up.
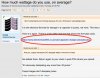
Are you kidding me? Click, RL. Click. I provided a hyperlink in two places that takes you to the calculator and standardized definitions for many electrical properties. It's the text in blue that now appears three times because you included it in your quote! In case you have difficulty seeing blue, I've circled the URL in the hyperlink in red.,

hyperlink.jpg

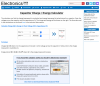
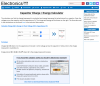
When you (left) click that text in any of the three places with your mouse or touch it with your finger on smartphone/pad, the hyperlink will *magically* take you to that URL without your having to copy and paste it! What happens next? You find yourself on this page:

Screen Shot 2020-05-06 at 7.30.41 AM.png

Now enter some values for V and C in the appropriate form on the screen. Let's take your amp for example.

Screen Shot 2020-05-06 at 7.32.32 AM.png

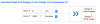
Next, as I mentioned there is a hyperlink on this screen that leads you to another page with various electrical formulae. In this case the magic hyperlink is on the word "here" as shown in this paragraph of text:

Screen Shot 2020-05-06 at 7.34.39 AM.png

Here's the resulting screen:

Screen Shot 2020-05-06 at 7.46.26 AM.png

Now for quiz time. Return to post #148. How many hyperlinks do you find there? (hint: look for the blue text and try them out)

Sheesh!
 

Attachments

  • Screen Shot 2020-05-06 at 7.30.41 AM.png
    Screen Shot 2020-05-06 at 7.30.41 AM.png
    464.7 KB · Views: 0
Last edited:
Status
Not open for further replies.
Back
Top Bottom