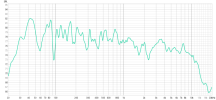
I tried something new for analysis. The room treatment remained as in my last post with graph.
I got the cardiod mike, and made up a correction curve for it from the published response curve and
an absolute sensitivity measure.
I then made up an impulse track with a 6 dB down point of 525 Hz. This has impulses from left (first)
and right (second) speakers. The equalizer is in use. I then took time responses with the cardiod mike,
top being the front facing halfway between the speakers, at the usual listening position, This is the top
response line. The bottom line is with the front of the mike facing exactly backwards from the
same position.
View attachment 3726104
Its interesting that despite the rather different gains in the equalizer below 500 Hz, the overall impression
is that the two sides are roughly equal. This is a very interesting finding and was worth buying a mike just for it.
Its an Audio-Technica ATR2500x-USB. One requirement was that it has a published response curve and published
rudimentary (few frequencies) polar curves. Its a lot higher noise floor than the omni one I got. The frequency response of the mike is
corrected by the curve I installed.
I also did the same with clicks made with a center frequence at about 800Hz, in the range of the midrange speaker.
Note that this one does not reproduce the same reflection timings as the one above, as the midrange and
woofer are at very different heights.
View attachment 3726134
I didn't do the tweeter since I can barely hear it.
These sort of tests provide more info than possible with an omni mike.
Doug McDonald