• The move to the new server is done. There are some software and database maintenance updates in process. This has us passing the hat around to help out. We appreciate any donations. Seriously, even a dollar helps. The payment page may be found here - https://www.audiokarma.org/support.html

Effects of MC Loading

I notified the owner of abxtests.com that it’s down - he’s traveling ATM.

It's still an interesting test to perform.
I also don't expect any measurable results, also considering loading it down to extremely low resistance load is not something that is done in practice, so going below 10 ohms just causes other problems. And I also expect the efficiency of a cartridge to be extremely low. Well below 1% (looking at how low efficiency of most speakers are with in comparison huge magnets (in case of mm) and coils (in case of lomc)
But the proof of the pudding is in the eating :biggrin:

It is, though I’ll likely leave it to others. I find it’s rather difficult to reason people out of something they were never reasoned in to, so there’s only so much effort I’m willing to exert. Listening tests are really the final arbiter - if someone can pass one of those with at least a 9/10 a couple times…

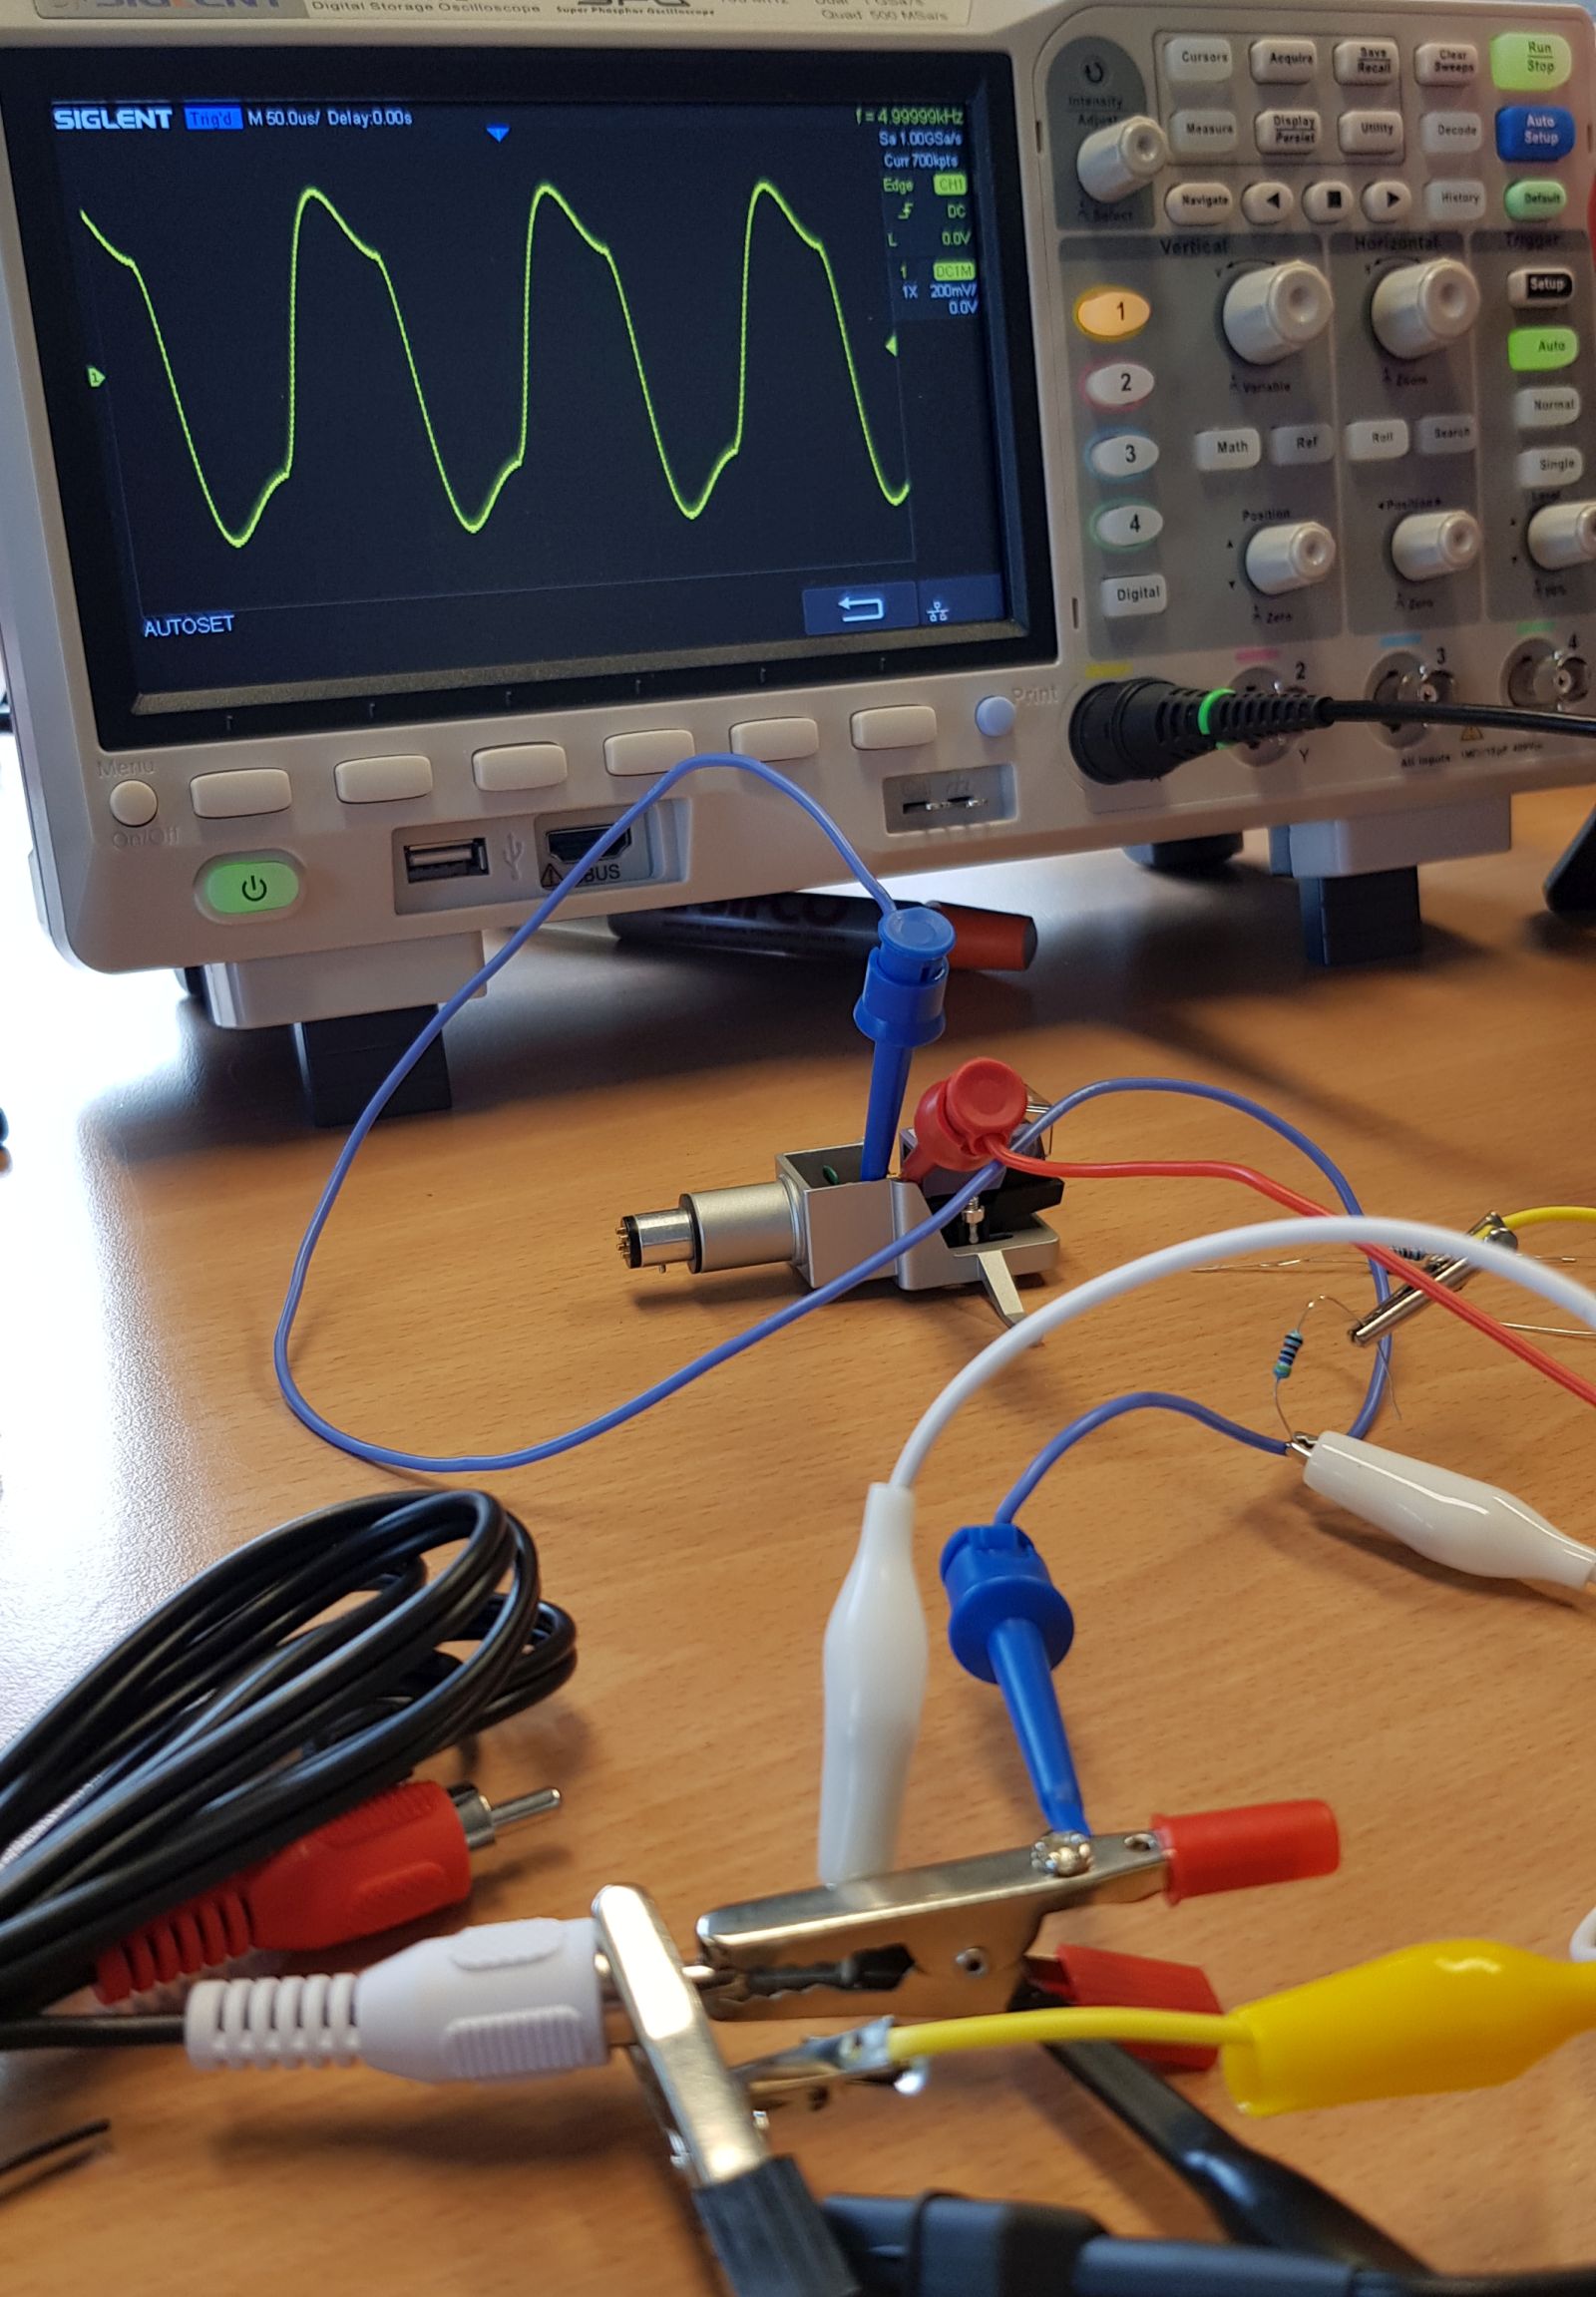
With the bodeplot feature on my oscilloscope.

It’s funny, I discovered that the thread where you did your first work on that in 2020 was the likely information source for some rather convoluted notions on square waves I tried to address a few months ago. The info in that thread was correct though - not sure how it became so misconstrued today.

Anyway, did you have the added C and R in parallel or in series to the coil?
 
Last edited:
With the bodeplot feature on my oscilloscope.

Yes, but how exatly does that work?

I.e., I'd assume that a signal generator would be required for the purpose, be that integrated in the scope or a separate one - and that the signal generator would then run a sweep into the scope input with the cartridge as well as the load capacitance and load resistance installed in parallel, and then (or first) another sweep without the cartridge and load capacitance and load resistance to have a reference for the original phase and frequency response of the signal generator, so the scope can then determine and show the actual differences. Or maybe even both sweeps can be done at the same time, if the signal generator sports two individually buffered, parallel outputs and the scope two input channels.

Got no experience with such a measurement, though - hence my question.

Greetings from Munich!

Manfred / lini
 
It’s funny, I discovered that the thread where you did your first work on that in 2020 was the likely information source for some rather convoluted notions on square waves I tried to address a few months ago. The info in that thread was correct though - not sure how it became so misconstrued today.

Anyway, did you have the added C and R in parallel or in series to the coil?
Yes, R and C in parallel to the cartridge coil.

A thread in 2020? that's a long time ago :)
I do remember using square waves to proove a concept. But to get an exact frequency and gain of the resonance, it's finecky. So its a more crude method, but making a bode plot either takes a lot of manual work, or requires a fairly modern oscilloscope and signalgen, from the same brand, or a high end oscilloscope with built in signal gen (so expensive equipment), whereas a used 80's scope and signalgen can do a square wave.
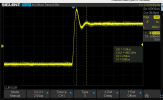
For instance, these are the resonances visible on that same DL-160 with the square wave method.
Modern scopes have very nice cursor lines to measure everything out.
horizontal cursor:
1707231217832.png

Here I clock about 490kHz for the resonance peak, which I guess is pretty similar as the peak in the bodeplot. But with the cursors it's way more difficult to place them exactly 1 wavelength. In this case it's very visible, but with an MM cartridge, it's usually not.

Vertical cursor:
1707231339149.png

Here I measure a gain of 7mV on 11.4mV base. that equates to 4,16dB gain. Again pretty similar to the bode plot. However, with MM it's not often that similar, as waveforms like this can occur:
at440-47k-china.jpg

Where do you put the cursors then? :biggrin:
 
Last edited:
Yes, but how exatly does that work?

Got no experience with such a measurement, though - hence my question.
It depends on the setup you have.
I have a siglent SDS1104xe and SDG1032x. One of the cheapest combinations to get a bode plot (at least 5 years ago, maybe now different better/cheaper models are on the market)
This is a tutorial that explains how the setup works:
Obviously I don't use the 50 ohm terminators on the oscilloscope.
There are some small differences compared to the firmware of the scope in the video. Like I have to put in the number of points or number of points per decade and in the video it's low, medium or high, that sort of differences.

Basically the oscilloscope takes over the function generator (through USB link, but sometimes through ethernet link is also possible). The fuction generator is dual channel, the channels are linked. one channel goes directly to the oscilloscope, the other one goes through the DUT to the oscilloscope. The oscilloscope measures per frequencypoint the gain/loss and phaseshift of the DUT channel compared to the direct channel and makes a graph of it showing gain and phase.
 
Last edited:
I do remember using square waves to proove a concept.
Ya, I think they confused response of a generator injected square wave with a test record square wave, and made up some causal linkages.

My Siglent scope has a generator, so it’s self-contained for bode plots, and I can use MultInstrument with my ADI-2 Pro R.
 
You can also use the programmatic interface of different gear to facilitate. I often use my 34465A as a DAQ that way.
 
and I can use MultInstrument with my ADI-2 Pro R.
Yes using an audio interface with specific software is also an obtainable way. Not that the ADI-2 pro R is exactly obtainable, it's top of the line, but most modern cheap audio interfaces already have a 192khz DAC/ADC so you can bode plot up to ~90kHz.

For people who want to do this kind of stuff.... when doing a bode plot on a cartridge (or any other measurement)..always keep in mind that the coil wires are really really thin and that the voltage levels should be kept at a sensible level.
 
Last edited:
I think the most obvious thing that people miss is that levels have to be matched as small differences are perceived as tonal.
This was noted back in the mid '70s in TAS, albeit for comparing amps and preamps. IIRC the point was regarding level difference of 0.5 dB or less. The point was basically ignored. Now I'll go and try my ear at the test.
 
  • Like
Reactions: JP
What is the current setup that you have?

Oh, I haven't got any proper measurement setup worth mentioning. In fact you'd probably laugh your a** off, if you'd see my old Voltcraft 1010 o'scope - which actually is an RFT EO 211, made in the former GDR, and which I haven't used for so long, that I'd almost bet, that it no longer works.

Greetings from Munich!

Manfred / lini
 
In fact you'd probably laugh your a** off, if you'd see my old Voltcraft 1010 o'scope - which actually is an RFT EO 211
I googled and indeed it's exactly how I pictured 70's eastern europe :biggrin:
But if you're ever going to orient into more modern equipment, next to the formentioned Virtins multi-instrument pro software (and an audio interface), or digital oscilloscope with bodeplot functionality, something like a Diligent Analog Discovery 2/3/pro might also be an interesting choice.
 
Last edited:
This was noted back in the mid '70s in TAS, albeit for comparing amps and preamps. IIRC the point was regarding level difference of 0.5 dB or less. The point was basically ignored. Now I'll go and try my ear at the test.

Goal today is 0.1dB to ensure no impact. Seems the site is still down - hope the owner can address that soon.
 
Last edited:
(...) I googled and indeed it's exactly how I pictured 70's eastern europe :biggrin: (...)

Oh, well, according to a German RFT collector's web-site, they started to manufacture that EO 211 around the mid 80s. :)

Greetings from Munich!

Manfred / lini
 
Goal today is 0.1dB to ensure no impact.
For this, when I make listening fragments for tests, I use the loudness normalisation option in audacity and then normalize it to a certan amount of LUFS on percieved loudness.
Do you think this method is sufficient?

these are usually listening fragments with slightly different sections of a piece of music (slightly different lengths etc)

I've casually listened to it and for my ear it sounds sufficient but I never made a good study on it though.
 
For this, when I make listening fragments for tests, I use the loudness normalisation option in audacity and then normalize it to a certan amount of LUFS on percieved loudness.
Do you think this method is sufficient?

these are usually listening fragments with slightly different sections of a piece of music (slightly different lengths etc)

I've casually listened to it and for my ear it sounds sufficient but I never made a good study on it though.

That‘s what I usually use, though for comparisons I always use the same sections. Were I to distinguish a difference where I shouldn’t be able to, I’d revisit the level matching to be doubly sure that wasn’t the cause, but that has never happened.
 
Back
Top Bottom