

You are using an out of date browser. It may not display this or other websites correctly.
You should upgrade or use an alternative browser.
You should upgrade or use an alternative browser.
Persistent Buzzing When Stylus Makes Contact - Need Help Troubleshooting!
- Thread starter djchaseb
- Start date
-
- Tags
- buzzing uturn uturn orbit
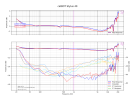
Thank you very much for analysing my rip!
Did you apply the B&K's correction (that is necessary with their QR2010 test record as well as with the record I used)?
When I use that correction with the SpectraPLUS-SC I get a bit flatter plot.
Could you check - and give your opinion on what's beyond 20Hz~20kHz limits? I have not got B&K QR2010 to measure the tonearm+cartridge resonance, I can only see its' there but can't measure how bad it actually is.
PS
The nasty curve at 400Hz must be SL-J2's plastic tonearm flexing out of shape. As soon as I manage to tame the ~13Hz peak, - I will try fixing that "fishing rog" thing.
PPS
This offtopic should be moved to the "30 vs 40" thread, where it is more relevant.
PPPS
Could you please share your plot-viewer tool?
Did you apply the B&K's correction (that is necessary with their QR2010 test record as well as with the record I used)?
When I use that correction with the SpectraPLUS-SC I get a bit flatter plot.
Could you check - and give your opinion on what's beyond 20Hz~20kHz limits? I have not got B&K QR2010 to measure the tonearm+cartridge resonance, I can only see its' there but can't measure how bad it actually is.
PS
The nasty curve at 400Hz must be SL-J2's plastic tonearm flexing out of shape. As soon as I manage to tame the ~13Hz peak, - I will try fixing that "fishing rog" thing.
PPS
This offtopic should be moved to the "30 vs 40" thread, where it is more relevant.
PPPS
Could you please share your plot-viewer tool?
Attachments
Last edited:

JP
7480 74111110101115
B&K cut their test records in the typical fashion of CV from 1kHz, which is really just RIAA/IEC without treble emphasis. I apply RIAA treble emphasis by biquad to undo the treble de-emphasis your phono stage did. I built that functionality in to the plotting script so I just needed to resample to 96k as I don't (yet) have good separate biquads for 192k.
The cart/arm resonance is pretty bad as far as those go. You can do an FFT but I find that a good quick way to get a sense for where you're at is to just look at the waveform in a DAW, like Audacity. The catch is that it takes experience of looking at many to get a sense of it.
It's a bit difficult for me to get in to the weeds as I've no experience with your test record which makes it very difficult to differentiate anomalies from test errors.
The cart/arm resonance is pretty bad as far as those go. You can do an FFT but I find that a good quick way to get a sense for where you're at is to just look at the waveform in a DAW, like Audacity. The catch is that it takes experience of looking at many to get a sense of it.
It's a bit difficult for me to get in to the weeds as I've no experience with your test record which makes it very difficult to differentiate anomalies from test errors.
I watch the goniometer (SCP, the stereoscope) in SpectraPLUS-SC and the start of the left- or right-only channel sweep, near 20Hz, looks not as a straightish line but as a full-blown ellipse or even a circle. This means (as I think) the tonearm needs huge amounts of damping at ILF.
JP
7480 74111110101115
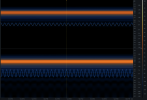
It's going to modulate at the same level regardless of the frequency being played. Below is your lead-in and the 1kHz pilot tone. The highlighted portion is 1.8s (one revolution at 33) so you've three warps exciting the resonance. Two are about the same amplitude but one with longer duration, and one is short duration and lower amplitude. One cycle is about 0.077s which is 13Hz.

No, after I install some sort of an electro-dynamic damping (by means of Foucault's current in the optoshutter that controls the sled drive) I plan to replace the original platter with the AT665, so there would be no warps. No warps and properly damped tonearm - will solve this issue (I hope).
I'm still not ready for my Stylus 10 rip.Whenever you have it, I'd be curious to see the data.
This guy promotes his low-noise wide-band RIAA preamp by showing some rip spectre. He used an AT-91 cartridge - with very heavy needle (a bonded conical).
I mention this because the spike at ~16kHz in his demonstration resembles very much the spike I saw at ~24kHz with Stylus 10. And this spike is gone as soon as I installed Stylus 40.
I'm sure - this is the groove+needle resonance we should avoid by all means.
Last edited:
JP
7480 74111110101115
Thank you very much for analysing my rip!
Did you apply the B&K's correction (that is necessary with their QR2010 test record as well as with the record I used)?
When I use that correction with the SpectraPLUS-SC I get a bit flatter plot.
Could you check - and give your opinion on what's beyond 20Hz~20kHz limits? I have not got B&K QR2010 to measure the tonearm+cartridge resonance, I can only see its' there but can't measure how bad it actually is.
PS
The nasty curve at 400Hz must be SL-J2's plastic tonearm flexing out of shape. As soon as I manage to tame the ~13Hz peak, - I will try fixing that "fishing rog" thing.
PPS
This offtopic should be moved to the "30 vs 40" thread, where it is more relevant.
PPPS
Could you please share your plot-viewer tool?
The correction file looked odd to me so I took some time to analyze it today.
I'm not sure how this is applied as with a RIAA phono stage there should be no correction below CV as T1&2 are used to cut the record. Regardless, if I plot the values (red) against the RIAA curve (blue):

Yellow is what I worked out as the likely resultant correction with an (not quite) 3dB/oct additional correction above 1kHz, I assume because you're doing FFT without octave smoothing so you need compensate for the energy difference due to the sweep being log. The correction below 1kHz isn't correct as it's linear, though it shouldn't be being used anyway.
This file is a generated 20Hz to 45kHz log sweep as you should get from the test record via a RIAA phono stage were everything "perfect". As such if you run it through your measurement process you should get a result that's flat if everything is working correctly.
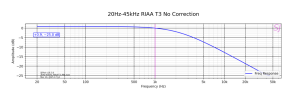

Spreadsheet here: https://docs.google.com/spreadsheets/d/1mK4hYGUUJVAllxQOI_m4C-EgxesVdmfB9dgqiI0dCas/edit?usp=sharing
The script I use is at https://sjplot.com.
Last edited:
JP
7480 74111110101115
I'm still not ready for my Stylus 10 rip.
This guy promotes his low-noise wide-band RIAA preamp by showing some rip spectre. He used an AT-91 cartridge - with very heavy needle (a bonded conical).
I mention this because the spike at ~16kHz in his demonstration resembles very much the spike I saw at ~24kHz with Stylus 10. And this spike is gone as soon as I installed Stylus 40.
I'm sure - this is the groove+needle resonance we should avoid by all means.
Far too narrow for that. I captured the audio and with RX 11 did a spectrum copy and zoomed in the waveform - it's a pure tone that's in the recording.

Alas, the author of that correction pased away recently, so I missed the opportunity to ask for the proper usage...The correction file looked odd to me so I took some time to analyze it today.
I'm not sure how this is applied as with a RIAA phono stage there should be no correction below CV as T1&2 are used to cut the record.
He suggested two other variants of corrections (see attached).
If you have time for that, - I'd be hugely grateful for your analysis.
Thank you, I will use this script now instead of the SpectraPLUS-SC's built-in tool.The script I use is at https://sjplot.com.
Attachments
Yes, the spike I saw with Stylus 10 was way much broader. But it too did not depend on the audio contents.Far too narrow for that.
JP
7480 74111110101115
Alas, the author of that correction pased away recently, so I missed the opportunity to ask for the proper usage...
He suggested two other variants of corrections (see attached).
If you have time for that, - I'd be hugely grateful for your analysis.
Thank you, I will use this script now instead of the SpectraPLUS-SC's built-in tool.
BKlogscale looks like B&Klogcor but with unusual frequency values. B&Kcor is generally what I'd expect to see, though you'd want to apply the inverse for correction. I've not plotted it, but at least the levels at the ends and middle make sense.
Use it with the test file I linked above to see what your result is. If doing FFT there will be a 3dB/oct slope as I've not corrected for that.

Hmmm...Use it with the test file I linked above to see what your result is. If doing FFT there will be a 3dB/oct slope as I've not corrected for that.
I must be doing something wrong (on MS Exel 2010). It looks like that:
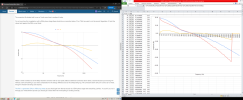
As my rips are 192kHz, I'm yet to try the Python script on them.
I'm still studying the spectres with the SpecraPLUS-SC.
I was optimistic too much when I declared that the needle+groove resonance is no more with the Stylus 40. Actually it is still there - now on 39kHz, This means (according to the LTspice model I posted earlier) that the vinyl compliance under the FG70 needle is equal to 0.055µm/mN. That is a bit more load than under the 18µm sphere (0.045µm/mN) but much less load than under a typical ellips (0.075µm/mN). An "undisturbed" vinyl has 0.035µm/mN compliance.
It is good to see that the model works and my "measurements" are not meaningless too much.
I'm still studying the spectres with the SpecraPLUS-SC.
I was optimistic too much when I declared that the needle+groove resonance is no more with the Stylus 40. Actually it is still there - now on 39kHz, This means (according to the LTspice model I posted earlier) that the vinyl compliance under the FG70 needle is equal to 0.055µm/mN. That is a bit more load than under the 18µm sphere (0.045µm/mN) but much less load than under a typical ellips (0.075µm/mN). An "undisturbed" vinyl has 0.035µm/mN compliance.
It is good to see that the model works and my "measurements" are not meaningless too much.
Last edited: