• Please note that Audiokarma will be offline briefly for updates early on Monday morning, September 28th.

AK Design Collaborative - Insignia-Class Economy Speakers (a.k.a Indignia)

Im watching those too...but go for em. I may just go to CC and pick up something to hold me over until this project underway. Tried my local GW, and they had less than nothing. :(
Wait a week before resorting to BB or CC. We're but days away from some answers here.... :thmbsp:
 

Looks pretty good to me, Dave. (personal preference coming) However, I might push the tweeter up a hair more to drop that little hump in the 750-1800 range. It's not much but ears are pretty sensitive there. That would probably give a very "up front" presentation. Some folks might like it that way, just not me. Does that create too much of a dip at 2k?

Ray
 
Ray, thanks for the comments, it's a concern of mine, as well. Unfortunately, I was playing around on my inlaws computer and forgot to email myself the file to continue playing when I got home. I would rather have a small dip there than the slight bump and it would probably help protect the tweeter a bit.
 
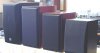
Lineup

JBL E30, PE 0.38, PE 0.25, Presidian.

[No Indignias, alas.... :p: ]

attachment.php


Ray, thanks for the comments, it's a concern of mine, as well. Unfortunately, I was playing around on my inlaws computer and forgot to email myself the file to continue playing when I got home. I would rather have a small dip there than the slight bump and it would probably help protect the tweeter a bit.
Upping the HP "Q" might get it, too, lifting the region above 1.8 kHz concurrently, but I like the approach of raising the frequency as part of that, if possible.... :yes:
 

Attachments

  • Cab Lineup.jpg
    Cab Lineup.jpg
    21.9 KB · Views: 531
Ok, beginner update time again. What Dave has done here is to take 2 of the drivers that we've put forth, the Dayton DA175 that Zilch likes and the Dayton DC28 tweeter. He designed a crossover for them, probably using a textbook crossover (the equations that you can find in the Loudspeaker Design Cookbook or various programs/spreadsheets around the 'net) as a starting point and then massaging values to get the following:


What we have here is a 2nd order low pass filter for the woofer and a 2nd order high pass filter with a padding resistor for the tweeter. In mathspeak 2nd order means that the transfer function of the filter has 2 poles. In practical terms it means that there are 2 components to the filter, a cap and an inductor. A cap will block bass (with the starting frequency dependent on the value) and pass treble and an inductor will do the opposite. I'll leave the mechanics of how they do it for a physics thread. Anyway, on the woofer filter the inductor in line will block the treble getting to the speaker. The capacitor will be an alternate path for treble to get to ground (- lead) so less goes to the speaker. We need more than 1 component because it's not a brick wall but a smooth transition. So when you cascade components like this it means the filter will roll off more quickly. A 1st order filter rolls of (in a perfect world) at 6dB/octave meaning that 1 octave away from the filter frequency the filter output will be 6dB down. Another octave away and it'll be 12dB and so on. A 2nd order rolls off at 12dB/octave. Each additional order will increase the rolloff by 6dB.

The resistor in the tweeter filter will mean less current flows in that circuit so the output will be lower. The amount depends on the resistor value and the impedance of the tweeter (or in this case the impedance of the rest of the circuit as "seen by" the resistor).

Ok, digest that for a minute or 2 and we'll move on to the graphs.

Ray
 
dnewma04 said:

Ok, here we have the theoretical output of the crossover from above. The black curves are the original frequency response curves of the individual drivers. The one on top that starts dropping as the frequency goes down is the tweeter. The fact that it's higher means that the tweeter is more sensitive than the woofer. The woofer curve starts down low comes up and levels out, starts to roll off around 1500Hz or so and then comes back up with that jagged peak. The jagged peak is called the breakup mode of the aluminum cone. What that means is that as you get up to the 7-8kHz range the cone itself starts resonating and ringing. It's usually worse with metal cones than paper or poly which are self-damped. Metal cones will need either physical damping (e.g. JBL Aquaplas) or a crossover that makes sure the response is very low by the time the breakup happens (Dave's method).

The blue curve is the result of the woofer AND the low pass filter. You can see that it starts rolling off around 1200-1300Hz. At twice that, 2500Hz it's down by about 12dB, as predicted by the 2nd order crossover. By the time we get out to the breakup it's down by about 35dB. That should be enough to keep us from hearing it.

The red curve is the tweeter AND filter. Note that the overall output is about 6dB down from the tweeter alone due to the resistor. It also shows a 12dB/octave rolloff.

The yellow curve is the combined response of the woofer and LP filter + tweeter and HP filter. When you add 2 (voltage) signals of equal value you get 6dB. Shown where the red and blue curves cross and the yellow is 6dB higher.

Now for the concern voiced, there is a slight hump in the yellow curve from about 700Hz to about 1800Hz. This is smack in the middle of the midrange where your ears are most sensitive. With this range being higher than the surrounding frequencies it could make the speaker very "up front" sounding. If we were to move the tweeter's high pass filter frequency then the red curve would start rolling off at a higher frequency, thereby lowering that hump. However, it would also cause the area directly above that to be drawn down which would leave a dip in the response around 2kHz. That would tend to make vocals and upper mids sound a little more "relaxed" or "laid back". This part of the design comes down to a lot of personal preference on the part of the designer. I'd rather have the recessed mids. Some people want the singer sitting on their lap.

Ok, questions? Beuller? Beuller?

Ray
 
Maybe a poll for x-over slope?(with short explanations on each)? Im such a layperson...Im just spitballing.

Thanks!


D
 
Is there no way to get to the middle ground, by using different value caps, etc? Just speculating here. That chart looks pretty damn flat as is, though! :thmbsp:
 
Thank you, Ray, for the tutorial update! :thmbsp:

Now, it's my job to take the simulated design, build it, and measure the results.

I have the boxes and crossover parts, and tomorrow, I should have the drivers. I'll put it all together according to the design and fire up CLIO, the performance measurement system here. That'll give us our first look at how well the actual "product" conforms to the intent, on the basis of which the team will make suggestions as to how the design might be optimized.

It'll also give us the first listen, and that's where a significant element of subjectivity enters into this process. I should be able to hear if there are major problems in the basic design, i.e., with the drivers themselves or how they play in combination, the choices we have made for box size and tuning, and crossover frequency and slope.

Once it all works, then other team participants will likely build according to the specifications themselves and independently verify the performance findings, both subjectively and with measurements. Then, we'll finalize a design which anyone can build and achieve the same result.

[Could be it'll suck, too, of course, and we'll have more comprehensive redesign work to do.... ;) ]
 
Thanks for the translation guys. Hard enough to do the work, let alone to have to stop and explain it. Can't wait to hear (through Zilch's ears) the results.
 
Upping the HP "Q" might get it, too, lifting the region above 1.8 kHz concurrently, but I like the approach of raising the frequency as part of that, if possible.... :yes:

Is there no way to get to the middle ground, by using different value caps, etc?

Ok, 2 things. First, if you just change the caps then you are changing the crossover frequency. Second, basically that's what Z was saying above. By rearranging the cap and inductor values on a filter you can change it's Q. The Q is a number that describes the shape of the transition area. With a low Q the transition will be smoother, up to a point. At some point the poles of the filter will diverge and you'll get something that looks like a 1st order filter that slopes down to another 1st order filter and you've lost your smooth transition. A higher Q means a sharper transition. As the Q goes up more it starts to create a hump just before the curve starts down. This can be used to flatten out a driver response where it takes a dip, comes back up, and then rolls off.

After Z gets the thing all put together we'll know if that hump is audible/objectionable. If it is then we'll either change the XO frequency or change the values to get a sharper transition.

Ray
 
Ok, here we have the theoretical output of the crossover from above.

Ok, questions? Beuller? Beuller?

Ray

Where did the graphs come from... the speaker manufacturer? or do you guys just know this stuff from the specs?:scratch2:
 
Where did the graphs come from... the speaker manufacturer? or do you guys just know this stuff from the specs?:scratch2:

When you start designing speakers you gain access to a secret database full of stuff like that. You have to have a special ring and know the daily password.

Ok, now on to real life. We'd have to ask Dave for sure as he may have samples on hand that he measured but I suspect he used resources on the 'net. For some drivers PE has data on their site. These being Dayton, PE's house brand, they usually have a full complement. If you look at the page for the DA175, http://www.partsexpress.com/pe/showdetl.cfm?&Partnumber=295-335, you'll see a link "Exported CLIO Frequency Response (15 kB TXT)" below the description. This is the response curve. The CLIO format means that it's notated in column form as frequency, output (in dB), phase angle. If you download those numbers, put them into Excel or similar, and generate a graph you'll get what Dave posted as the raw woofer curve. Several crossover and simulation programs will let you import these numbers and will apply the theoretical crossovers to those curves to generate the new filtered ones.

You dig?

Ray
 
I can confirm what Ray said.

I used speakerworkshop which is free ware and allows you to import the data from PE. The way I do it is to open the CLIO impedance and frequency response charts, select the actual data and paste it into notepad in windows. Then I save the impedance data as a .ZMA file and the frequency response data as a .FRD file. Then import into speakerworkshop and start to play. It's not an ultrasimple program to use, but it certain returns more in depth results than something like just using a piece of box building software like WinISD.

For someone just getting into speaker building who wants to explore things in more detail, it's a good starting point for software. Build a Wallin Jig, get a behringer mic and some sort of mic preamp with phantom power and you are well on your way.

Another excellent resource can be found be googling the FRD consortium. It's got a page full of useful acoustic calculators/spreadsheets.
 
One word of warning, I just realized that I didn't use a driver offset on the crossover modeled previously. There could be a dip or hump in the response because of what is probably a 2.5" offset in acoustic centers of the woofer and tweeter. I just don't have time right now to change it to see the results but will try to get to it shortly after the fest when things start to settle down a bit.
 
Back
Top Bottom