• Please note that Audiokarma will be offline briefly for updates early on Monday morning, September 28th.

dumptruck is finally building ewaves for real

I measured mine from a work bench...kind of sort of midway between floor and ceiling.... Anyone know where to find a tutorial on measuring and gating?
Same setup here - a little above midway. The only actual tutorials that I've found are done by people that have no real experience or knowledge whatsoever - good intentions but really not helpful at all. I've been slowly piecing together an understanding of how this stuff works through a combination of manuals and random technical papers on measuring drivers. Definitely not there yet.

You are collecting hundreds or thousands of measurements. The gating/smoothing doesn't change the raw data (at least in HolmImpulse). That's how you can change back and forth.
Yeah I get that part, same in ARTA. It's determining the quality/usability of my raw data that is my current concern. I guess what I meant in my comment is that if the gate starts way before the impulse, but needs to end ~2ms after time 0, I am uncertain what that does to the math being done behind the scenes, which I am only beginning to figure out.
 
Last edited:
2 ms should get you gated response down to about 500Hz according to the program I use, Fuzzmeasure. That's a wavelength of about 27".

I'll let you do the trig, but depending on the height of the speaker, what you are seeing can be a floor bounce reflection. So the floor bounce is, according to your graph, taking an extra 2ms to arrive at the mic, and that is dependent on the height of the speaker. Sound will travel approx 27" in 2 ms.

If you ungate the response, you should see some FR anomaly at 500Hz.

What I would try is to measure at let's say 22" (height, arbitrarily) then 44" height, and see if that 2 ms peak gets further away at the greater height. If so, it's a floor bounce reflection. If not, it's part of the driver response, or maybe something coming off of something else. But I think it's floor bounce and you can confirm it.

Disclaimer: I am writing this at 5:16 AM and I am tired. That absolves me of any sins and irrational thoughts.

Measuring face up from the floor seems like a good idea. Now, face down into bed. :boring:
 
Last edited:
Another thing worth mentioning: You don't need to have very low frequency gating to design your crossover. If you're already down to 500 Hz, that's below your crossover point and you're good to go. I recognize the desire to get the measurements accurate as low as possible, but it's not really necessary.

I have insomnia.
 
If you're already down to 500 Hz, that's below your crossover point and you're good to go. I recognize the desire to get the measurements accurate as low as possible, but it's not really necessary.
True, kind of, plus I'm getting a nice long flat response over the crossover range from both drivers (I'll show you guys that later), and I don't think I'm having any measurement problems bad enough to screw up a crossover design here.

I have two worries about the crossover, and both have to do with accidentally creating a shelf in the frequency response:
1. The 500-2000Hz region. I'm seeing a 5dB rise here. I think it's real, but I want to be sure before I design a crossover that drops the woofer efficiency by 5dB (ouch).
2. The <500Hz region, I don't need it one bit to make a smooth crossover, but the baffle step frequency is down there (I estimated it once, but I forgot, low 200s I think).
 
Well okay, my speakers are bigger than a 4pi, so if Wayne isn't worrying about BSC maybe I won't, but I still have the apparent 1-3k shelf in the woofer response to worry about. I mean, it should be no problem to flatten it without even doing anything tricky - just tweaking the standard crossover slopes. I just want to make sure it's real/accurate enough.
 
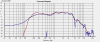
Another thing to look at. 44" away, woofer measured from the tweeter axis. Red is ungated & smoothed 1/3-octave, blue is gated as marked. There is still no bass on the red because I didn't include it in the signal. Is it possible this is a dip at 700Hz, rather than a response that starts rising at 700Hz? I know, I know, it's not exactly a huge anomaly either way.. It's just that "a little hot from 1-3kHz" is something I know I don't like.

attachment.php


P.S. In other news of messing around with measurements:
- the DE250 looks just like everyone else's DE250
- the polar response of the woofer seems to indicate the usual ewave crossover point will be appropriate (just a sloppy method, but it seems to be easy to get consistent polars in the crossover region)
- the dubious distortion readings from HOLMimpulse show a curious, huge plummet in odd-harmonic distortion from the woofer >1.5kHz.
 

Attachments

  • TD15M_tweeter-axis_44-inch.gif
    TD15M_tweeter-axis_44-inch.gif
    12.7 KB · Views: 207
Last edited:
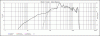
So I went ahead and took three measurements at 44" on the tweeter axis and went into PCD. I think it worked. This (black line) is the separate measurements, summed in PCD. The grey line is the measurement of both drivers (sans <1kHz). The part where it doesn't match up is where the woofer has a big resonance, so I'm thinking that miiiight be why I can't get it to match there. How I have it now has z-offset at 0.04, which is 1mm off my physical measurement of the z-offset.

Note: if you don't know what I'm up to here, this is summed response with no crossover and out of phase - it ain't supposed to look good.

edit: CRAP, I just realized I used an 8-ohm impedance plot and I have the 4-ohm woofers... I wonder what that did to this.... maybe nothing... more tomorrow.

attachment.php
 

Attachments

  • Graph1.gif
    Graph1.gif
    23 KB · Views: 198
Last edited:
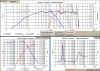
Here's an attempt in PCD with impedance data from the TD15M-8 halved (because I have nothing else to do for now without the correct .zma file). I may be totally mistaken about what I've got here, but here's what I think:

- designing straight on-axis, midway between drivers
- same crossover topology as the Deluxe, but no variable L-pad included
- lowered acoustic crossover point to 1500Hz
- simulated primary lobe is 0°, secondaries at -50° and 43.5°
- relatedly, nulls are at -21.8° and 19.3° (41.1° primary lobe height)
- +/- 2.6dB on-axis response

The PCD files used are attached below, if anyone wants to play along. I'm not entirely clear on what settings will come up with the file, so here are a bunch:
Measuring distance = 1.118
Tweeter y-offset = 0.159
woofer y-offset = -0.159
woofer z-offset = .040
(all other offsets = 0)
Piston diameter: experiment as you wish. Woofer sd would work out to a 260mm diameter, cone diameter is around 13" I think.
2nd order parallel woofer: L2 = 1mH, 0.3Ω. C2 = 33uF.
2nd order parallel DE250: L9 = 0.47mH, 0.22Ω. C9 = 4uF.
series resistor tweeter: 7Ω
parallel resistor tweeter: 15Ω

attachment.php
 

Attachments

Last edited:
OK, question:
What are the 3 measurements and what is summed in PCD as stated in post 109?

The system impedance looks reasonable, so maybe you are doing alright by halving the 8 Ohm zma.

Where does PCD show the simulated lobes?

Wish I had my TD woofers.

Nice work so far. Now will you experiment with slopes and crossover frequencies?
 
What are the 3 measurements and what is summed in PCD as stated in post 109?
My last two posts are using the same data. 3 measurements are: one of each driver and then both drivers at once, all on the tweeter axis, 44". I will remeasure from the midpoint axis that I ended up using, which may be a little more accurate.

The system impedance looks reasonable, so maybe you are doing alright by halving the 8 Ohm zma.
Yeah, I really don't know how close that is to the real thing.

Where does PCD show the simulated lobes?
(correct me here if I'm confused about anything, experts):
- First, you need to have the drivers summing well enough and at the right frequency so that if you click to invert one of the drivers, you get a great big null at a reasonable vertical axis/angle for listening. That's the middle of your primary lobe.
- Then, keeping everything else the same, move the vertical listening position up (and then down) until you find the centers of the next two nulls. Since you have one driver inverted, still, these are the secondary lobes.
- Then, set it back to the middle of your primary lobe and put the drivers back in phase. Now you can scroll up and down vertically looking for nulls again, but this time they are nulls, rather than secondary lobes.

Now will you experiment with slopes and crossover frequencies?
I already did that quite a bit, and this seems to be the neighborhood that gives me a decent angle and size on the primary lobe, but I will keep doing it. Next up is actually back to measurements. I am going to try to get good polar measurements on the woofer. That should indicate the ideal place to try to get the vertical nulls to hit, which I can compare to what I'm doing in PCD.
 
That's great, yes I understand, thanks for the explanations.
I do remember the last time I opened PCD that there was a clicker to change the vertical simulation.

I noticed in post 99, the last impulse you showed, which starts at time zero, zero phase. Is that the way you treat all three measurements? Then you align the separate measurements for woofer and tweeter to match the measurement of both together in PCD, right? I think I got it. So all 3 measurements are set for zero phase, right?

Happy tweaking, looks like great fun.
 
I noticed in post 99, the last impulse you showed, which starts at time zero, zero phase. Is that the way you treat all three measurements?.... So all 3 measurements are set for zero phase, right?
That's a good question. I think the answer is NO. Not understanding how HOLMimpulse was going to use those settings (if at all) when exporting the response, I measured one driver, let the program choose "time 0" automatically, and then locked it to that for the following measurements. At the moment, I'm totally stumped as far as how to verify what it did by looking at the frd files. However...

Then you align the separate measurements for woofer and tweeter to match the measurement of both together in PCD, right?
I loaded the measurement of both together into the main overlay in PCD, put in my physical measurements for the measurement distance and the vertical driver offset (just the woofer, since I was on tweeter axis this time). Then I changed the z-offset distance until the combined response matched up to the overlay. Since that z-offset matched reality, I figured the frd files must be correct in relation to each other. :dunno:
 
Do you not have a way to measure impedance (a WT3 or the like)? If not, the 8 ohm values divided by two won't be horribly far off. But a woofer tester of some variety would be a good investment.
Your biggest danger is in making sure you have the relative delays between drivers right. Double check that, then you should be in good shape.

Your tweeter measurement looks like it has a strong reflection in it, though. Was there something about 12 inches away from the mic when you measured? - the ripple occurs about every 1kHz.

You'll be really happy with those parts -- I've done that QSC waveguide with a D220ti and liked it a lot, and the DE250 is better. Also now using DE250 with a TD15M, which is a great combo.
 
Send me your address via PM and I'll send you my WT3. Of course you'll need to send it back. A small thank you for working up the ewave badges. :thmbsp:
 
Back
Top Bottom